Los Angeles Police Department: Building a unified CompStat process across 21 divisions
Brenna Swanston
September 26, 2025
KEY IDEAS:
- Comprising four bureaus and 21 geographical divisions, the Los Angeles Police Department (LAPD) struggles with fragmented, siloed data, which creates challenges for reporting.
- Peregrine integrates and standardizes data across the LAPD’s many disparate divisions and between its legacy and current information systems.
- The LAPD now conducts dynamic, interactive CompStat briefings using real-time data in Peregrine, which automates analysis and modeling for a streamlined process.
- Within six weeks of deployment, more than 1,000 users at the LAPD were trained on Peregrine. Agency personnel took more than 344,000 actions in Peregrine during July 2025.
”Peregrine has been a game-changer, an amazing tool and partner that has revolutionized how we look at crime through our CompStat process.
Jessica Statland
Senior Crime and Intelligence Analyst, Los Angeles Police Department

LOS ANGELES — As the third-largest police department in the U.S., the LAPD employs more than 8,700 sworn officers and serves nearly 5 million residents across 21 geographic divisions. Tracking, analyzing, and reporting crime trends is a massive undertaking for the agency, which dedicates an entire CompStat Division to compiling, analyzing, and mapping data to illustrate the impact of crime in local communities, highlight issues pertaining to police personnel and risk management, and plan deployments of personnel.
Keep reading to explore the major challenges facing the LAPD’s CompStat Division and how effective data integration helped personnel solve for those challenges.
What challenges did the LAPD face with CompStat?
The LAPD’s vast size and unique structure — along with recent changes to its data management and reporting processes — have encumbered the CompStat Division with information silos, data fragmentation, and inefficient workflows.
In 2024, the LAPD deployed Peregrine to integrate siloed information systems, streamline data analysis and modeling, and build a common operating picture for the entire agency. The platform has since become a critical tool for LAPD personnel, who performed more than 640,000 actions in Peregrine during August 2025 alone.
“In about six weeks, we were able to train over 1,000 users,” including command staff and specialized detectives, said Senior Crime and Intelligence Analyst Jessica Statland. “This is a tool that is being heavily utilized.”
💡 WHAT IS COMPSTAT? The New York Police Department originally developed CompStat, short for “computer statistics,” in the 1990s. The process uses real-time data and analysis to hold law enforcement agencies accountable for performance and resource efficiency. CompStat is now the industry standard for data-driven police management, practiced by law enforcement agencies throughout the United States.
How did Peregrine streamline CompStat for the LAPD?
Peregrine has proven especially useful for CompStat at the LAPD by automating manual workflows, enabling the instant creation of dynamic data visualizations, integrating community sentiment data, and marrying legacy data sources with the agency’s current information systems.
”Peregrine has been a game-changer, an amazing tool and partner that has revolutionized how we look at crime through our CompStat process,” Statland said.
READ MORE: Modernizing CompStat for the 21st Century
LAPD CompStat: Before Peregrine vs. after Peregrine
| Before Peregrine | After Peregrine |
|---|---|
| Fragmented crime analysis processes across 21 divisions made CompStat difficult | Standardized dashboards create a common operating picture for all LAPD divisions |
| Siloed data between the agency’s legacy RMS and its new RMS | Bridged the gap between the legacy RMS and new RMS to bring historical and live data into the same place |
| Tedious manual analysis including pulling records, cleaning data, and reporting to command staff | Automated workflows to streamline analysis and reporting |
| Inefficient, expensive, or insufficient methods of measuring and reporting community sentiment | Integrated Zencity survey data with other agency data to bring community sentiment metrics into CompStat |
| Static data visualizations for CompStat briefings | Dynamic, interactive data visualizations that automatically update with real-time data |
Why was LAPD data fragmented?
The LAPD contains four operational bureaus comprising 21 divisions, each of which covers a different geographic area of the city. The agency takes what Statland called “a decentralized approach to crime analysts” — every division has its own team of analysts who determine their specific processes and workflows according to their area’s unique needs and priorities. Though effective in practice, this structure has historically hindered citywide crime reporting by creating data fragmentation and information silos across the LAPD.
”Everyone does things a little bit differently, but when it comes to looking at crime, we all have to be standardized,” Statland said.
Peregrine harmonized and integrated data from the LAPD’s disparate divisions, streamlining tedious tasks for analysts and building a common operating picture for the entire agency.
“We worked with Peregrine to create dashboards that are our standardized tool for how to look at crime, how to count statistics, and help make the mundane aspects of the crime analyst job a little bit quicker and easier,” Statland said.
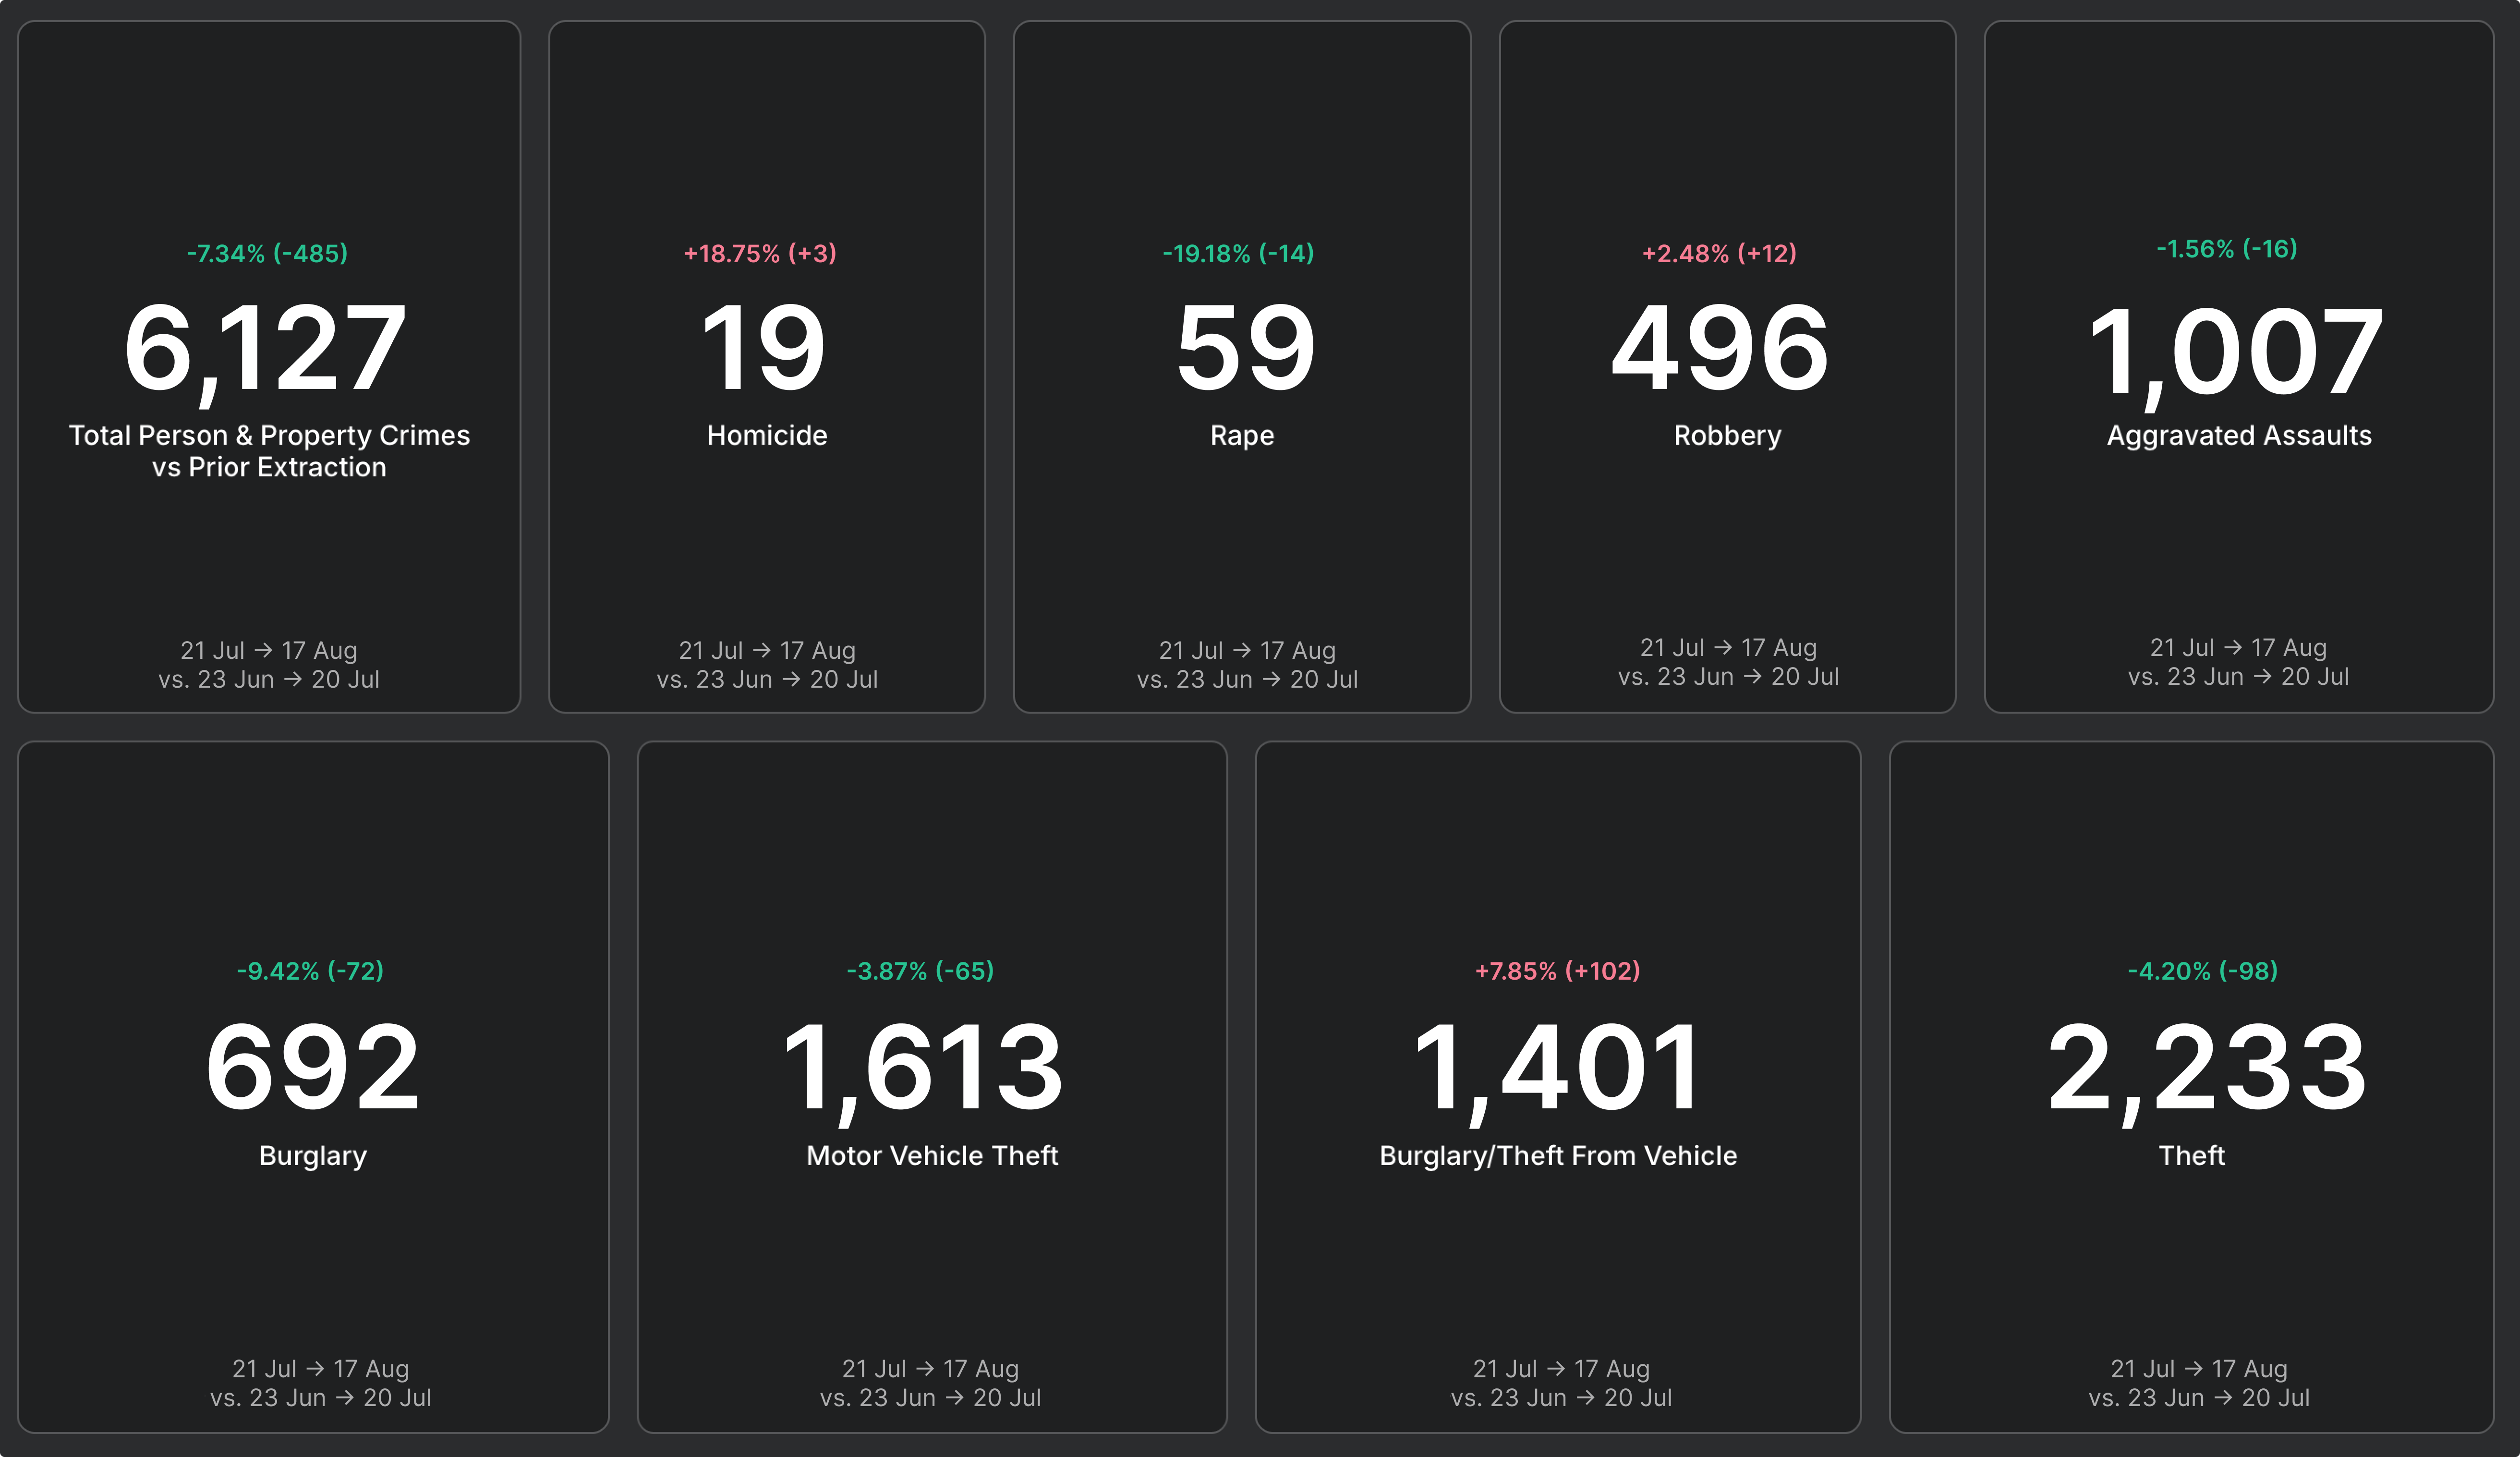
The above image contains notional data.
How did Peregrine assist with the LAPD’s RMS transition?
The LAPD made several changes to its data management and reporting processes in 2024, including transitioning to a new RMS and switching from summary reporting to NIBRS. As a result, historical data became siloed in the legacy RMS, and analysts had no efficient way to compare information between the old and new systems.
The RMS transition also threw a wrench in the LAPD’s public-facing crime reporting, creating a lack of transparency that impacted community sentiment.
“We had updated maps where you could go into as a neighborhood and get to see exactly what crimes were happening in your little area,” said Capt. Shannon White, commanding officer for the CompStat Division. “When we transitioned RMS, that disappeared overnight, and so did the public trust with it.”
Peregrine bridged the gap between the LAPD’s legacy RMS and its new RMS, unifying data from both sources on one collective, accessible platform. This enabled analysts to easily leverage historical data for comprehensive, cohesive context around emerging trends.
How does Peregrine automate analysis for CompStat?
Before Peregrine, CompStat Division personnel had to complete clunky, time-consuming workflows to compile the data needed for CompStat briefings, which until recently took place monthly. Analysts had to:
- Manually pull records from multiple disparate data sources
- Clean the data from those records and ensure all information was appropriately coded, mapped, and tagged
- Report to command staff with organized data that could be sorted by various metrics
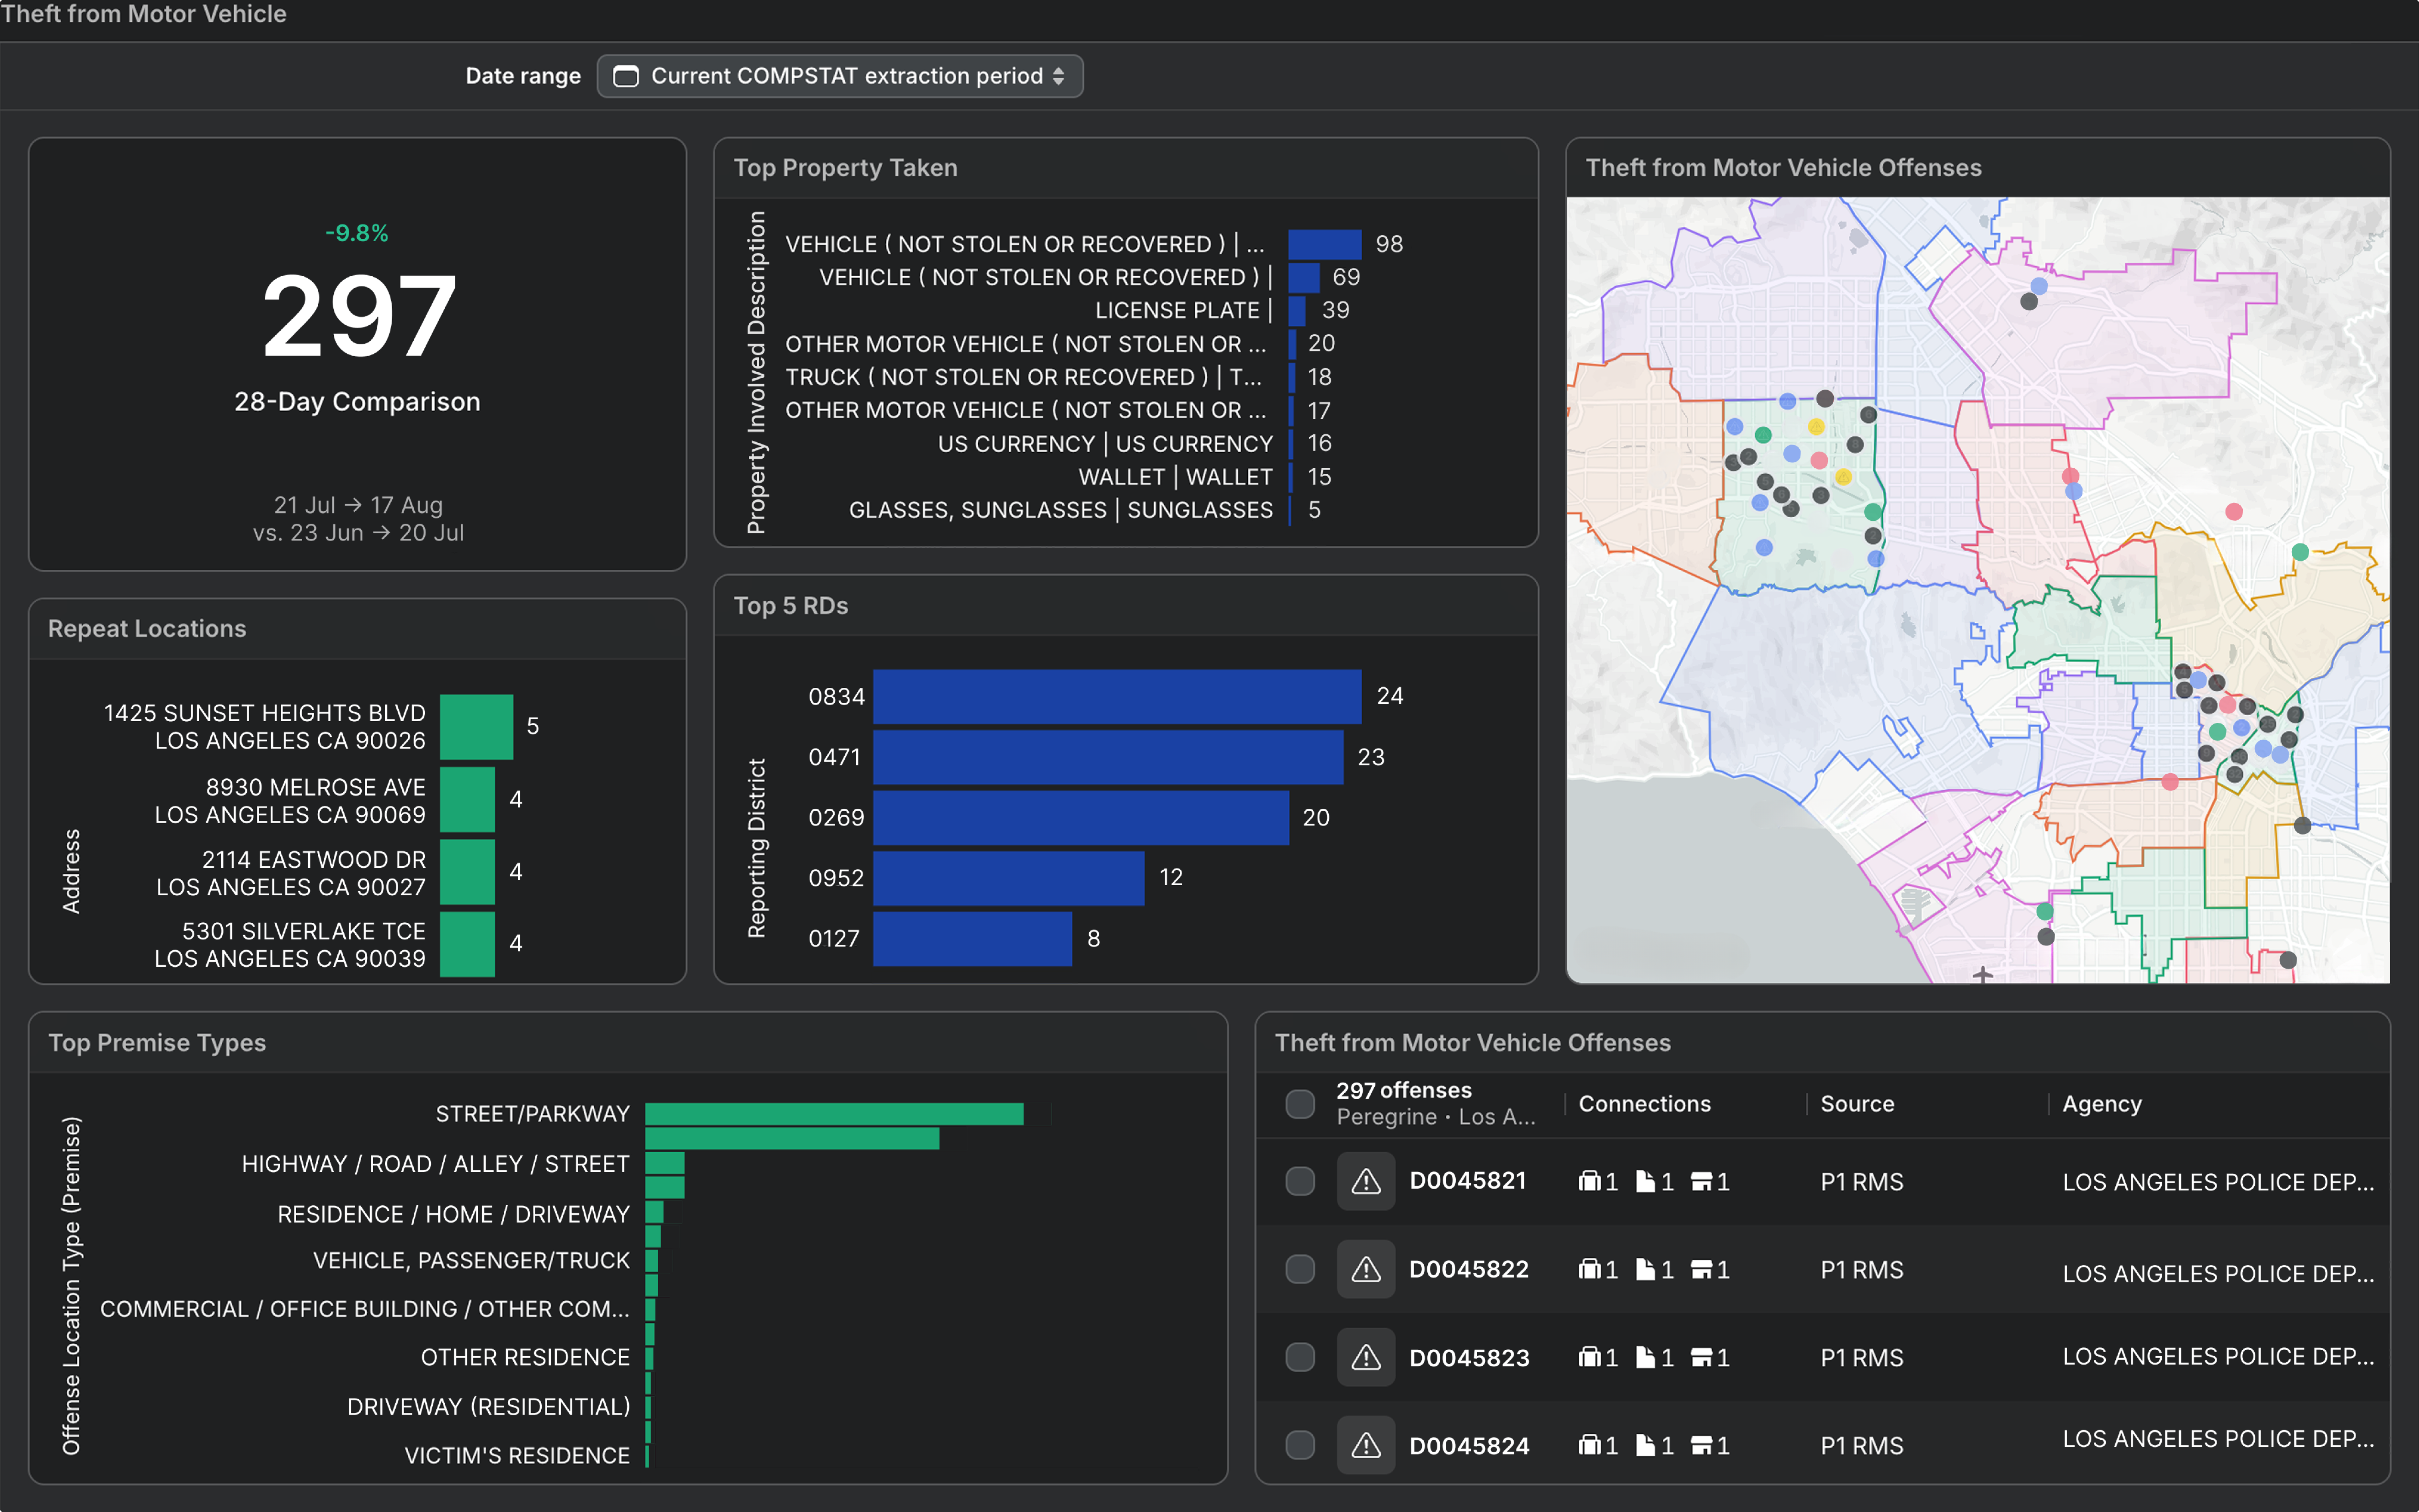
Peregrine automated the most mundane and tedious parts of these workflows so analysts could focus on their more pressing responsibilities. The LAPD also reduced the frequency of its CompStat briefings to quarterly.
“It makes the workload much, much less,” said Crime and Intelligence Analyst Laura Ellis.
The above image contains notional data.
How does the LAPD measure community sentiment for CompStat?
“It is critical that we are meeting the needs of the community and understanding where their concerns are and speaking to them as quickly as possible.” —Capt. Shannon White, LAPD
Crime data isn’t the only critical information analyzed in the LAPD’s CompStat briefings; the agency also reviews community sentiment data to ensure the agency is responding appropriately to the community’s needs.
“It’s not just what we’re seeing in the crime numbers,” Capt. White said, “We’re also addressing those quality-of-life concerns that community members may bring up.”
However, the LAPD historically lacked a reliable, efficient way to measure and report community sentiment. Service audits were too susceptible to bias. Community police advisory board meetings were only accessible to residents who had time to attend. Annual surveys were costly.
The agency ultimately turned to Zencity, which creates questionnaires and distributes them among representative samples of community members to gather resident feedback. Zencity also integrates with Peregrine, allowing the LAPD to bring reliable, organized community sentiment data into its CompStat process.
“We're helping the divisions message appropriately so the [community’s] sense of safety is actually aligned with what our real crime stats are, and we're honoring the work that the officers are doing each day,” White said. “It is critical that we are meeting the needs of the community and understanding where their concerns are and speaking to them as quickly as possible.”
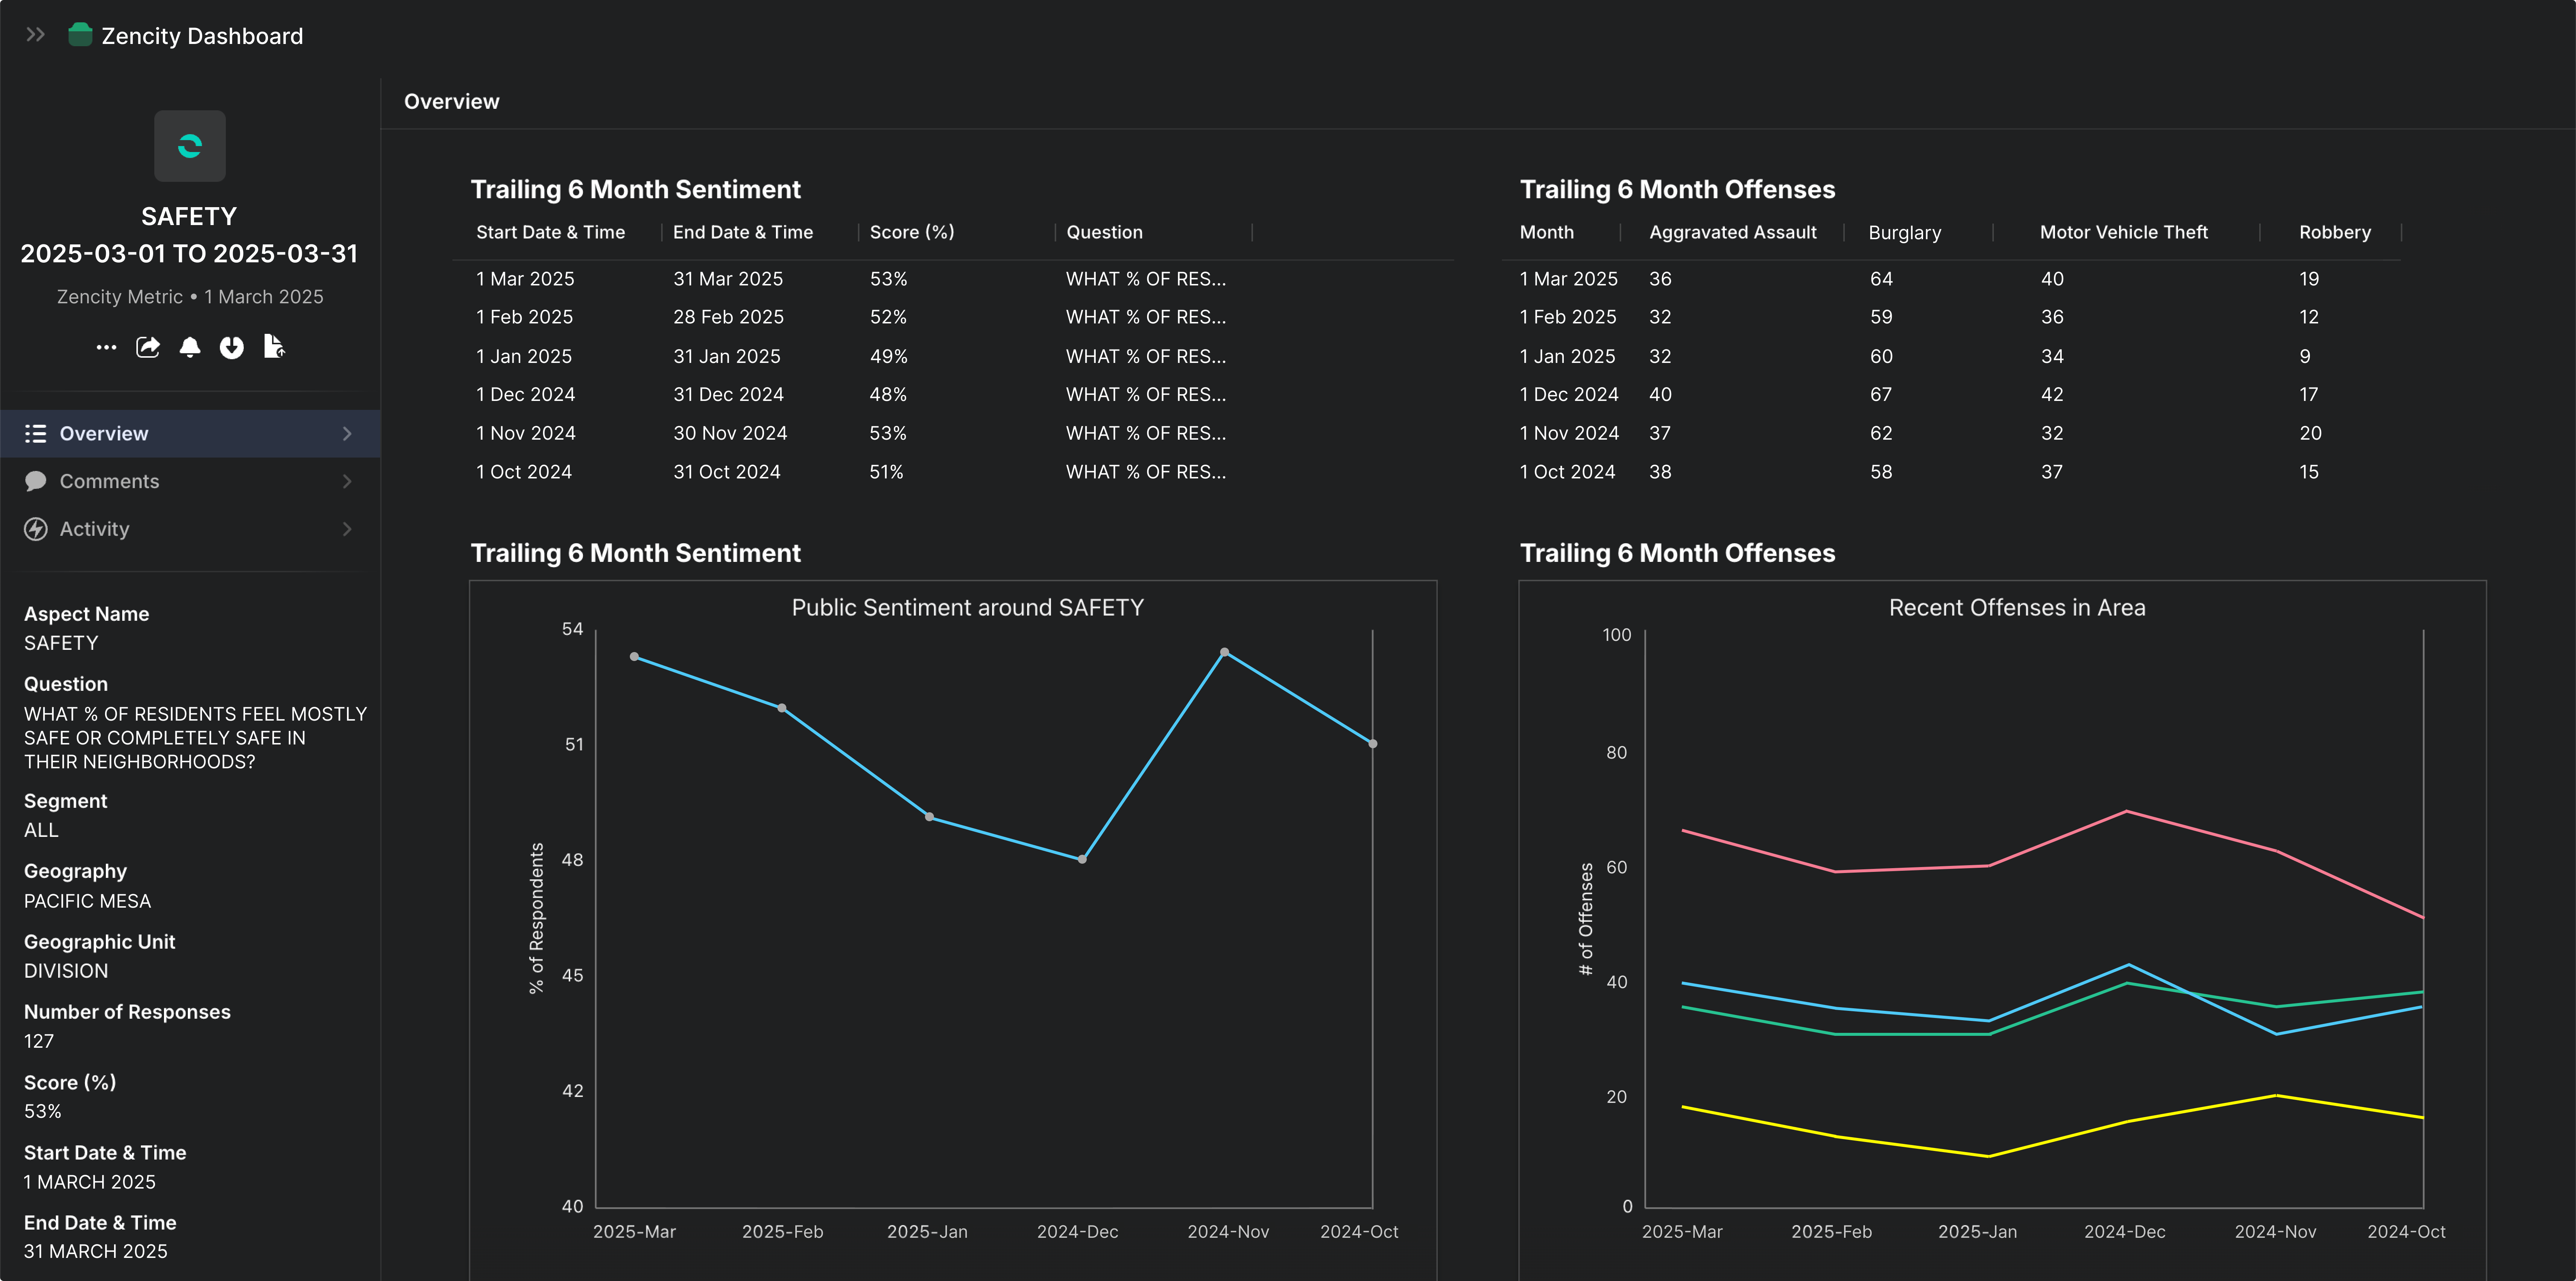
The above image contains notional data.
💡 KEY TAKEAWAY: Zencity automates community surveys to gather sentiment feedback from a representative population sample. Peregrine integrates Zencity survey data with other agency data to easily bring community sentiment metrics into the LAPD’s CompStat briefings.
How does Peregrine enable more dynamic CompStat briefings?
“Now, it’s such a dynamic presentation that we can drill down into any of these crimes, into any of these areas, in real time, while we’re discussing them.” —Laura Ellis, Crime and Intelligence Analyst, LAPD
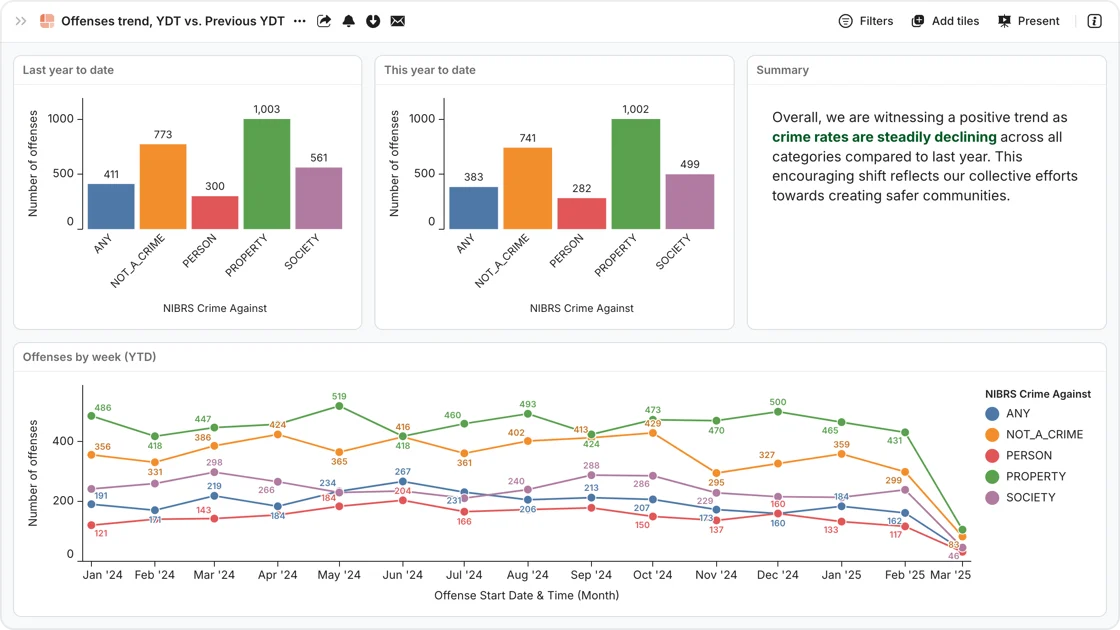
The LAPD’s CompStat briefings historically used only static data visualizations, which weren’t interactive and couldn’t account for real-time data updates.
”LAPD has a very comprehensive CompStat process. We inspect on a lot of metrics, but visually, it used to be a very static presentation,” Ellis said. “We displayed maps of current and previous extraction periods alongside various fixed reports.”
Peregrine elevated the agency’s briefings by providing dynamic, interactive visual aids that automatically update as new data comes in. CompStat attendees can engage with Peregrine’s data visualizations to drill down into specific crime types, locations, and even individual incidents, all using the most up-to-date data available.
“Now, it’s such a dynamic presentation that we can drill down into any of these crimes, into any of these areas, in real time, while we’re discussing them,” Ellis said.
The above image contains notional data.
Modernize CompStat for your agency
CompStat can enhance accountability, public trust, and data-driven decision-making — but for many law enforcement agencies, it comes at a price. Any CompStat program can get bogged down by tedious, manual reporting processes and static data visualizations, ultimately limiting effectiveness and eating up precious resources.
From high-level trend summaries to in-depth analyses of specific variables, Peregrine provides instant analytics, comprehensive reporting, and interactive data visualizations that automatically update with real-time information. We enhance your agency’s CompStat process so personnel can spend less time building reports and more time making the critical decisions that help keep your community safe. To learn more about modernizing your CompStat process, schedule a demo.
Frequently asked questions (FAQs) about the LAPD’s CompStat modernization
What is CompStat in policing?
CompStat, short for “computer statistics,” is a data-driven police management and accountability process that was first developed by the NYPD in the 1990s. Now an industry standard, CompStat helps agencies track crime trends, allocate resources efficiently, and demonstrate accountability through regular data briefings.
What challenges did the LAPD face with its CompStat process before Peregrine?
Before deploying Peregrine, the LAPD struggled with fragmented data, siloed reporting across 21 divisions, a difficult records management system (RMS) transition, and time-consuming manual crime analysis workflows. These challenges limited transparency, slowed down analysis, and made it difficult to report real-time crime trends in an interactive, dynamic way.
How did Peregrine help the LAPD modernize CompStat?
Peregrine unified data from legacy and current RMS systems, automated manual workflows, and created standardized, interactive dashboards for the LAPD’s CompStat briefings. This allowed the agency to streamline crime analysis and reporting and conduct dynamic CompStat briefings using real-time data.
How does the LAPD report community sentiment data in its CompStat briefings?
The LAPD integrates Zencity survey data in Peregrine to analyze and report reliable resident feedback. This community sentiment data is presented alongside crime statistics in CompStat briefings to enable holistic reporting of both safety metrics and quality-of-life concerns from local residents.
What are the benefits of the LAPD’s new CompStat process?
With Peregrine, the LAPD streamlined tedious analysis and reporting workflows, enhanced transparency and engagement with LA’s communities, and improved accountability and decision-making for the agency. The LAPD now uses real-time, interactive dashboards that let analysts and command staff drill into specific crime types and locations instantly during briefings.