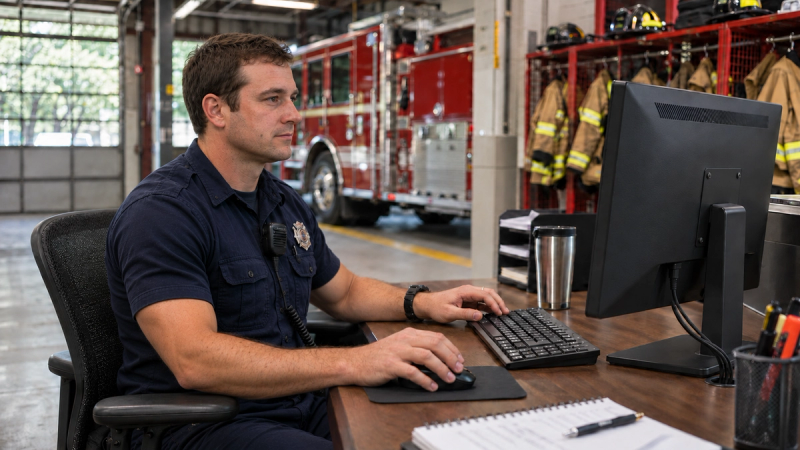
Fire department software is the set of systems that dispatch units, document incidents, map coverage, record patient care, schedule staff, track training, and maintain apparatus. Core systems include CAD, RMS, GIS, ePCR, staffing, training, and telematics. Data integration is the most pressing need because it connects them into one operational picture.
KEY IDEAS:
- Most fire and EMS departments run seven or more separate systems, and each one answers only part of a chief's questions.
- Every core system has a clear job. CAD times the response, RMS records the incident, GIS maps the risk, ePCR documents the patient, and telematics tracks the rig.
- Data integration unlocks full value because accreditation, coverage planning, budgets, grants, EMS billing, and wellness all draw on the same handful of systems.
- Departments can start with a data inventory and two test questions, without replacing any system they already use.
Fire departments invest in software and technology to answer high-stakes questions: how fast units arrive, where the next station belongs, whether a budget request will hold up in a council meeting, and which crew members are carrying the heaviest load. Each system in the stack holds part of the answer. This guide by Todd Tuggle, a retired California fire chief and Public Safety Executive at Peregrine, walks through the fire department software most departments run, why each system is needed, and why connecting them delivers more value than adding another one.
What is fire department software?
Fire department software is the collection of operational systems a department relies on to respond, document, plan, and report. Together these systems form the fire department tech stack, which typically spans dispatch, records, mapping, EMS, personnel, and apparatus systems, plus the spreadsheets and homegrown dashboards that carry institutional knowledge between them. Some systems are wholly owned by the department, while others are shared across other public safety services like law enforcement and 911.
Departments that build a data inventory list every one of these systems, including its owner, how often it updates, and who outside its primary users can search it. The exercise usually surfaces a pattern: each system serves its own users well, and very few people can see across all of them. As a result, leadership struggles to get the full data-backed operational picture of their department.
What types of fire department software make up the tech stack?
Most combination fire and EMS departments run the fire department software systems below. Each one is needed for a specific reason, and each one holds data that other parts of the department also depend on.
- Computer-aided dispatch (CAD): Logs calls, dispatches units, and timestamps dispatch, turnout, and arrival. It provides the response-time record behind every coverage and performance question.
- Records management system (RMS): Stores incident reports, outcomes, and prevention records. It documents what happened on each call and feeds national incident reporting.
- NERIS reporting: Submits incident data to the national all-hazards platform. Assistance to Firefighters Grant (AFG) recipients must agree to provide data to it, and it is now the nation's only fire incident reporting system.
- GIS and mapping: Defines planning zones, first-due areas, and road networks. It supports drive-time modeling and station placement.
- ePCR and EMS billing: Documents patient care and tracks reimbursement. It supports NEMSIS reporting, clinical quality assurance, and transport revenue.
- Station alerting: Tones out stations and units when a call dispatches. It shortens turnout time from the moment CAD assigns a call.
- Staffing and scheduling: Tracks assignments, overtime, and coverage. It shows who was on which apparatus and how much work each person carries.
- Training and certification records: Tracks hours, credentials, and renewal dates. It supports compliance, accreditation, and readiness.
- Apparatus telematics and maintenance: Captures engine hours, pump hours, mileage, and service history. It informs fleet readiness and maintenance decisions.
- Prevention and inspection tracking: Records inspections and code enforcement. It reduces community risk before an incident occurs.
Dispatch and records: CAD, RMS, and NERIS
CAD is the system of record for the response timeline. Its timestamps for dispatch, turnout, and arrival drive nearly every performance measure a department reports. The fire RMS records the incident itself, including call type, outcome, and narrative. Together they supply the raw material for national reporting.
As of early 2026, the National Emergency Response Information System (NERIS) is the nation's only fire and all-hazards incident reporting platform, having replaced NFIRS, which had collected fire incident data since 1975. Departments that receive AFG funding must agree to provide incident data to NERIS for the grant's period of performance, so the quality of RMS and CAD data can affect grant compliance.
EMS systems: ePCR, NEMSIS, and billing
Nationally, about 64% of fire department runs are EMS and rescue calls, according to the U.S. Fire Administration's run profile analysis, and the share runs higher in busy combination departments. Every ambulance transport is documented in an ePCR built to the NEMSIS standard, and a separate billing system tracks reimbursement.
For a single EMS call, CAD holds the timeline, the ePCR holds the clinical encounter, and billing holds the financial outcome. Fire departments evaluating EMS tools often search for ePCR software first. The larger payoff comes from joining the ePCR to CAD and billing, because a documentation gap between those systems can leave a completed transport unreimbursed.
Mapping, alerting, and apparatus systems
GIS defines the planning zones and road network behind drive-time and coverage modeling. Station alerting speeds the handoff from dispatch to crews. Telematics platforms such as Samsara and Geotab can push dozens of data points per rig to the cloud, including engine hours and mileage, and apparatus maintenance records often sit with an outside vendor. Fire engines now cost close to $1.1 million, up from about $589,000 in 2020, according to IAFF testimony before the U.S. Senate, so the data that guides how a department deploys and maintains each rig has real financial weight.
Personnel systems: staffing, training, and wellness records
Staffing and scheduling systems show which personnel worked which apparatus and how many overtime hours they carried. Training and certification systems track credentials and renewal dates. Fire department scheduling software is one of the more commonly searched categories, and the data it produces becomes far more useful when joined with call history, since workload and exposure only become visible when both sit side by side.
Why is data integration the most pressing need in fire department software?
Data integration is the most pressing need because the questions that matter most to a fire chief cross system boundaries. A single answer typically requires CAD timestamps, staffing records, GIS zones, and incident outcomes, and most of those systems were never built to share data with each other.
Try answering two questions using only the systems you know off the top of your head: how many hours did Engine 3 spend on EMS calls last quarter, and what is your 90th-percentile response time by planning zone? If either takes more than a day, or depends on someone who knows where the data lives, the department has found an integration gap.
Five areas of department performance depend on a small set of core systems: accreditation, resource allocation, budgeting and grants, EMS data, and first responder wellness. CAD, RMS, staffing, and ePCR each feed three of those areas, and GIS, training, and apparatus records each feed two. When several areas draw on the same one or two source systems, the department has one connection problem showing up in many places. Connecting those core systems once improves every area that depends on them, which is why an integration platform raises several capabilities at the same time.
What can fire departments do with an integrated tech stack?
An integrated stack supports five high-value use cases, each of which draws on the same underlying systems.
Accreditation and ISO reporting
Proving performance to the Commission on Fire Accreditation International (CFAI) or to ISO requires data from CAD, incident records, GIS, training systems, hydrant flow tests, and apparatus logs. CFAI's 11th Edition model measures agencies against 266 performance indicators, and it requires agencies to link their Standards of Cover data tables to NERIS beginning in 2027.
St. Petersburg Fire Rescue completed its CFAI calculations by hand for years, often during off-hours across a five-month stretch, while call volume grew from about 50,000 to more than 65,000 a year. After connecting its systems, the department completes the same calculations in minutes. Read the full St. Petersburg story.
Resource allocation and coverage planning
Drive-time modeling needs incident history, current apparatus status, and the real road network. Integrated data lets a chief model what a station closure or brownout would do to 90th-percentile response time in a specific zone. A department-wide average can look acceptable while a ten-minute gap sits in one neighborhood, and zone-level modeling exposes it.
Call volume is often the proxy for risk in brownout decisions, and integrated data lets a department weigh other factors alongside it, including real population, property value, and the consequence of damage to the properties protected. That analysis lives in the Community Risk Assessment, which is part of the accreditation process.
Fleet decisions benefit too. Joining CAD, RMS, and telematics data supports a burn rate multiplier built from engine hours, pump hours, mileage, and responses, which shows when a specific rig is wearing faster than its depreciation schedule assumes. Calendar-only maintenance applies the same schedule to a rig that runs 200 calls a year and one that runs 2,000, and usage data lets a department catch a developing failure first.
Budget justification and grant applications
Personnel costs typically consume more than 90% of a fire department budget, which leaves less than 5% in discretionary spending, according to FireRescue1. A request built on joined data, such as an EMS call volume increase in one zone mapped against falling unit availability, gives elected officials something specific to evaluate.
Federal grants raise the bar further. In FY2023, FEMA received 7,962 AFG applications and 2,191 SAFER applications requesting a combined $6.84 billion against a combined appropriation of $720 million, according to the Congressional Research Service. Cross-system evidence helps an application stand out in that pool.
EMS data integration
Joining CAD, ePCR, and billing lets a department trace one call from dispatch through treatment to reimbursement. The stakes add up: the CMS ground ambulance data collection report found an average cost of $2,673 per transport against an average reimbursement of $1,147. Clean, joined records also support Medicaid supplemental payment programs such as GEMT, where documented cost per transport determines the payment.
Integrated data also helps departments design alternatives to a standard apparatus response. Community paramedicine and mobile integrated health programs send specially trained personnel to patients who call 911 repeatedly for non-emergency needs, and identifying those patients depends on the same joined call and outcome data.
Firefighter and EMS wellness
Cardiac events, cancer exposure, sleep disruption, and burnout build up at the level of the individual member. Call history lives in CAD and RMS, clinical context lives in the ePCR, and workload lives in staffing systems. Connected, those sources show a member whose overtime, call exposure, and time since last check-in are all moving in the wrong direction at once. Reviewed separately by three people in three systems, the same signals stay invisible.
How can a fire department start integrating its tech stack?
Departments can start with three steps that require no system replacement:
- Build a data inventory. List every system, its owner, its update frequency, and who else can search it. Include spreadsheets and homegrown dashboards.
- Run the two test questions. Note exactly where the trail goes cold for the Engine 3 question and the 90th-percentile question.
- Score data maturity from 1 to 4 for each system category. A score of 1 means no one outside the owner can search the system. A score of 4 means any authorized person can pull current data in minutes. Prioritize any category scoring 1 or 2 that depends on a single person for access.
The department then connects the system that feeds the most low-scoring areas, or the system tied to an upcoming deadline such as an accreditation site visit or a budget hearing.
How does Peregrine connect the fire department tech stack?
Peregrine connects the fire department software a department already uses, including CAD, RMS, ePCR, GIS, staffing, training, and telematics systems, and combines their data into one operational picture. Departments keep the tools their crews know, and the data from each one becomes searchable, mappable, and reportable in a single place. Peregrine is typically deployed in as little as 90 days, and forward-deployed engineers handle integration and configuration around each department's systems, terminology, and reporting needs. More than 500 public agencies across fire-rescue, emergency management, and law enforcement trust Peregrine with their operational data.
See your own data in one view. Book a demo or explore Peregrine for fire-rescue.


 Your Privacy Choices